Vinmetrica Compares Well with Wine Testing Labs
Summary: Vinmetrica is participating in the CTS Wine Industry Interlaboratory Program this year. Along with 100 other labs, we tested two samples from CTS for up to 16 parameters. Using our products, we obtained results for free and total SO2, pH, TA, malic acid, and residual sugar that were in good agreement with those of the other participants.
We are pleased to report the first round of results from participating in Collaborative Testing Services’ (CTS) Wine Industry Interlaboratory Program for 2020. CTS (www.collaborativetesting.com) provides samples to, and analysis of the results from, participating laboratories in a wide variety of testing technologies. The Wine Industry Interlaboratory Program focuses on chemical and physical analysis of wine.
This last round of samples from CTS (“Cycle 065”) comprised two sweet red wines. About 100 labs across the US participated. The following parameters were available to be measured and compared: Total SO2, Free SO2, TA, pH, Residual Reducing Sugars, L-malic acid, %ABV, Specific Gravity, Glucose + Fructose, Copper, Potassium, A420, A520, L-lactic acid, Conductivity, and Methanol. We submitted results for all these except Copper, A420, and A520, the first because we don’t have the equipment for it, the latter two because we rarely perform them (though we can do so).
In Table 1 you can see all the results for CTS tests that Vinmetrica currently offers as kits for customers to run themselves (the other parameters were performed in our services lab). This table is a bit busy, so let me explain the columns briefly:
- The first column shows the test, then below that, the instrument, kit, or method used.
- The second column shows which of the two wine samples was run in the test.
- The “Vinmetrica mean” is our average result of two tests. All labs that chose to run a particular assay performed each test on each wine twice.
- The “CTS Grand Mean” is the average of all labs’ results, by all methods, that were included (i.e., not rejected as outliers) for any particular test. For most tests, different procedures might be employed by the various submitting labs.
- The “Grand Standard Deviation” (GSD) is my name for CTS’s Between-Lab Standard Deviation from the CTS Grand Mean of all included results. GSD is a measure of the variability among all the results for that test. You might expect a valid result to fall between ± 2 GSDs, and certainly ±3 SDs, of the Grand Mean.
- The “CPV”, or comparative performance value, is just the difference between our mean and the grand mean, divided by the GSD. The closer to zero this number is, the better the agreement of your result with the other labs’. A value less than ±2 will always fall in the accepted category. If the CPV lies outside of ± 3, the result is highly questionable and will be rejected in most cases, depending on the number of labs participating in a test. Any result rejected is indicated by the red X.
- “labs included/labs submitted” shows how many labs’ results were included and how many submitted. For example, 99 labs submitted results for Free SO2, but only 92 were close enough to be included in the statistics.
Table 1. Performance of Vinmetrica test kits and instruments in the CTS cycle 065 study. Click on the image to enlarge.
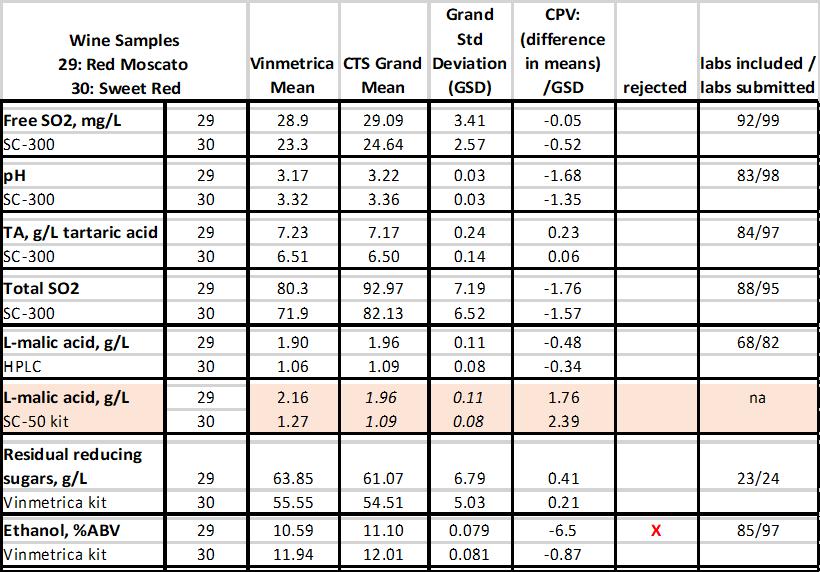
FREE SO2 First let’s look at the free SO2 results. Vinmetrica’s results with the SC-300 are pretty close to the Grand Means for both samples (0.19 and 1.34 mg/L lower for sample 29 and 30, resp.). This is what we’ve come to expect in comparing the accuracy of Ripper SO2 methods, especially Vinmetrica’s, to AO and other methods. CPV’s well below ± 1 also demonstrate this. Note that in Table 2, most labs used either Ripper titration (like we do) or aeration oxidation (AO) to determine free SO2. Overall, Ripper methods had a tendency to come in slightly higher than the Grand Mean, but we came in slightly lower.
Table 2. Methods used for free SO2 in the CTS cycle 065. Click on the image to enlarge.

We want to give everyone a good idea of the variability of free SO2 values. Figure 1 shows all labs’ results that were reasonably close to each other. The x-axis is the result for sample 29, while the Y-axis is the corresponding value for sample 30; each dot represents one lab’s pair of values. The ellipse encompasses all data pairs that CTS deemed statistically acceptable. Note that, for example, sample 29’s acceptable values across these 100 labs ranged from less than 23 to about 36 ppm free SO2; for sample 30 the range was from about 18 to 31. This is 13 ppm, quite a spread! Note also that Vinmetrica (“Laboratory 9350A”) came in close to the center of the ellipse.
Figure 1. Free SO2 Results for sample 29 and 30. Each dot represents one lab’s values. Vinmetrica’s result is circled. The ellipse encompasses all “acceptable” results. Click on the image to enlarge.

pH values We came in the normal range of the Grand Mean, CPV less than 1.7. Nevertheless the slightly lower values (about -0.04 pH units) have us working on response in lower pH ranges. Stay tuned here…
TA values You can see we are quite close to the Grand Means, effectively spot on!
Total SO2 Here we are also pretty good, given the rather large variability for this parameter among all labs. Our values at less than -1.8 CPV suggest we are doing fine, maybe tending to underestimate this value slightly.
L-malic acid We ran the tests two ways, but since CTS only allows one method to be reported, we submitted the values determined by HPLC in our Services lab. We did however run the SC-50 method on these samples as well, and we are sharing this in Table 1. You can see that both methods give values that are in good agreement with the CTS Grand Mean. Our HPLC method came within -0.5 CPV; our SC-50 method within 2.4 CPV
Reducing residual sugar test Results were quite close to the CTS Grand Mean (less than 0.41 CPV); we sure don’t have a problem with that!
ABV We came in quite close on Sample 30, but with a CPV of -6.5 for sample 29, we are scratching our heads. That would have us call a wine 10.6% ABV that others would call 11.1%, so, while not horrible, we should be able to do better. We are looking into it.
Other tests We also came out pretty well in tests that we only perform as services, including Specific Gravity, Glucose + Fructose, Potassium, Conductivity, and Methanol. But I will leave a discussion of these for a future report.
We are now working on the next cycle (066) that comprises two white wines. We’ll give you an update on that when we have it!
1/9/23….And here it is: Comparisons of Vinmetrica
Is this analysis published in a reputable journal?
Robert,
Thank you for reaching out to us. We did not publish our analysis of the results in any journal. We simply took the data they gave us regarding our Analytical methods and results and summarized them in this blog post. If you are interested in getting the full results please reach out to us directly and perhaps we can get permission from CTS to release the full results to you.
All of the information about CTS and their services offered and how their testing works can be found here: https://collaborative-testing.com/index-collaborative-testing.php#row-2
Let us know if you have any additional questions.
Taylor
Thanks for referencing these results